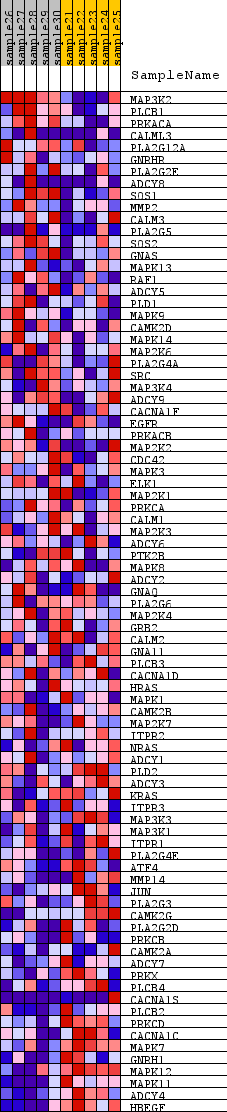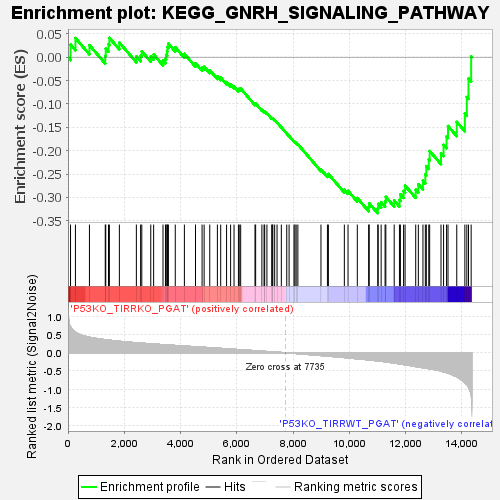
Profile of the Running ES Score & Positions of GeneSet Members on the Rank Ordered List
| Dataset | TIRR_p53KO_dKO_PGAT.P53KO_TIRRWT_PGAT_vs_P53KO_TIRRKO_PGAT.cls #P53KO_TIRRKO_PGAT_versus_P53KO_TIRRWT_PGAT |
| Phenotype | P53KO_TIRRWT_PGAT_vs_P53KO_TIRRKO_PGAT.cls#P53KO_TIRRKO_PGAT_versus_P53KO_TIRRWT_PGAT |
| Upregulated in class | P53KO_TIRRWT_PGAT |
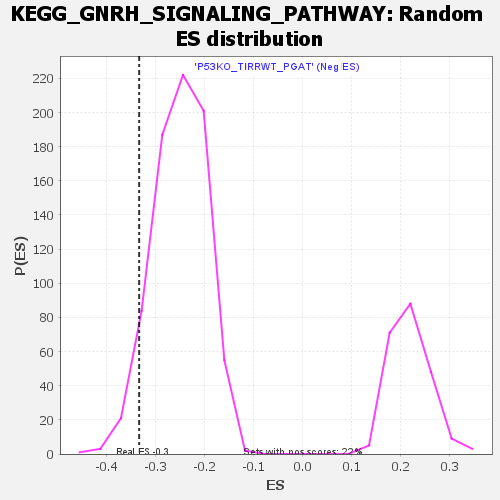
| GeneSet | KEGG_GNRH_SIGNALING_PATHWAY |
| Enrichment Score (ES) | -0.3338887 |
| Normalized Enrichment Score (NES) | -1.3330262 |
| Nominal p-value | 0.05541237 |
| FDR q-value | 0.19052155 |
| FWER p-Value | 1.0 |
| SYMBOL | TITLE | RANK IN GENE LIST | RANK METRIC SCORE | RUNNING ES | CORE ENRICHMENT | |
|---|---|---|---|---|---|---|
| 1 | MAP3K2 | n/a | 90 | 0.717 | 0.0269 | No |
| 2 | PLCB1 | n/a | 264 | 0.562 | 0.0408 | No |
| 3 | PRKACA | n/a | 762 | 0.426 | 0.0257 | No |
| 4 | CALML3 | n/a | 1324 | 0.358 | 0.0030 | No |
| 5 | PLA2G12A | n/a | 1342 | 0.357 | 0.0183 | No |
| 6 | GNRHR | n/a | 1440 | 0.347 | 0.0276 | No |
| 7 | PLA2G2E | n/a | 1471 | 0.344 | 0.0415 | No |
| 8 | ADCY8 | n/a | 1826 | 0.314 | 0.0312 | No |
| 9 | SOS1 | n/a | 2430 | 0.273 | 0.0016 | No |
| 10 | MMP2 | n/a | 2581 | 0.264 | 0.0033 | No |
| 11 | CALM3 | n/a | 2623 | 0.262 | 0.0126 | No |
| 12 | PLA2G5 | n/a | 2942 | 0.245 | 0.0017 | No |
| 13 | SOS2 | n/a | 3044 | 0.240 | 0.0057 | No |
| 14 | GNAS | n/a | 3377 | 0.221 | -0.0073 | No |
| 15 | MAPK13 | n/a | 3465 | 0.217 | -0.0033 | No |
| 16 | RAF1 | n/a | 3489 | 0.216 | 0.0050 | No |
| 17 | ADCY5 | n/a | 3525 | 0.213 | 0.0125 | No |
| 18 | PLD1 | n/a | 3534 | 0.213 | 0.0218 | No |
| 19 | MAPK9 | n/a | 3569 | 0.211 | 0.0291 | No |
| 20 | CAMK2D | n/a | 3813 | 0.199 | 0.0213 | No |
| 21 | MAPK14 | n/a | 4137 | 0.183 | 0.0072 | No |
| 22 | MAP2K6 | n/a | 4532 | 0.163 | -0.0129 | No |
| 23 | PLA2G4A | n/a | 4766 | 0.152 | -0.0222 | No |
| 24 | SRC | n/a | 4839 | 0.149 | -0.0203 | No |
| 25 | MAP3K4 | n/a | 5039 | 0.138 | -0.0278 | No |
| 26 | ADCY9 | n/a | 5310 | 0.125 | -0.0410 | No |
| 27 | CACNA1F | n/a | 5428 | 0.119 | -0.0437 | No |
| 28 | EGFR | n/a | 5637 | 0.108 | -0.0532 | No |
| 29 | PRKACB | n/a | 5780 | 0.102 | -0.0585 | No |
| 30 | MAP2K2 | n/a | 5902 | 0.095 | -0.0626 | No |
| 31 | CDC42 | n/a | 6058 | 0.087 | -0.0694 | No |
| 32 | MAPK3 | n/a | 6086 | 0.085 | -0.0673 | No |
| 33 | ELK1 | n/a | 6138 | 0.083 | -0.0671 | No |
| 34 | MAP2K1 | n/a | 6647 | 0.055 | -0.1001 | No |
| 35 | PRKCA | n/a | 6670 | 0.054 | -0.0992 | No |
| 36 | CALM1 | n/a | 6892 | 0.043 | -0.1127 | No |
| 37 | MAP2K3 | n/a | 6969 | 0.039 | -0.1162 | No |
| 38 | ADCY6 | n/a | 6991 | 0.038 | -0.1159 | No |
| 39 | PTK2B | n/a | 7071 | 0.034 | -0.1199 | No |
| 40 | MAPK8 | n/a | 7244 | 0.025 | -0.1308 | No |
| 41 | ADCY2 | n/a | 7258 | 0.024 | -0.1306 | No |
| 42 | GNAQ | n/a | 7281 | 0.023 | -0.1310 | No |
| 43 | PLA2G6 | n/a | 7346 | 0.020 | -0.1346 | No |
| 44 | MAP2K4 | n/a | 7431 | 0.015 | -0.1398 | No |
| 45 | GRB2 | n/a | 7583 | 0.008 | -0.1500 | No |
| 46 | CALM2 | n/a | 7776 | -0.002 | -0.1633 | No |
| 47 | GNA11 | n/a | 7859 | -0.007 | -0.1687 | No |
| 48 | PLCB3 | n/a | 8032 | -0.017 | -0.1800 | No |
| 49 | CACNA1D | n/a | 8067 | -0.019 | -0.1815 | No |
| 50 | HRAS | n/a | 8110 | -0.022 | -0.1834 | No |
| 51 | MAPK1 | n/a | 8171 | -0.026 | -0.1864 | No |
| 52 | CAMK2B | n/a | 8992 | -0.077 | -0.2403 | No |
| 53 | MAP2K7 | n/a | 9222 | -0.093 | -0.2520 | No |
| 54 | ITPR2 | n/a | 9256 | -0.095 | -0.2499 | No |
| 55 | NRAS | n/a | 9823 | -0.132 | -0.2835 | No |
| 56 | ADCY1 | n/a | 9954 | -0.142 | -0.2860 | No |
| 57 | PLD2 | n/a | 10284 | -0.166 | -0.3014 | No |
| 58 | ADCY3 | n/a | 10687 | -0.197 | -0.3204 | No |
| 59 | KRAS | n/a | 10707 | -0.198 | -0.3126 | No |
| 60 | ITPR3 | n/a | 11012 | -0.223 | -0.3235 | Yes |
| 61 | MAP3K3 | n/a | 11025 | -0.225 | -0.3140 | Yes |
| 62 | MAP3K1 | n/a | 11131 | -0.235 | -0.3105 | Yes |
| 63 | ITPR1 | n/a | 11271 | -0.249 | -0.3087 | Yes |
| 64 | PLA2G4E | n/a | 11298 | -0.252 | -0.2988 | Yes |
| 65 | ATF4 | n/a | 11595 | -0.283 | -0.3065 | Yes |
| 66 | MMP14 | n/a | 11782 | -0.306 | -0.3054 | Yes |
| 67 | JUN | n/a | 11816 | -0.309 | -0.2934 | Yes |
| 68 | PLA2G3 | n/a | 11929 | -0.323 | -0.2862 | Yes |
| 69 | CAMK2G | n/a | 11982 | -0.330 | -0.2746 | Yes |
| 70 | PLA2G2D | n/a | 12360 | -0.380 | -0.2835 | Yes |
| 71 | PRKCB | n/a | 12453 | -0.389 | -0.2719 | Yes |
| 72 | CAMK2A | n/a | 12617 | -0.411 | -0.2643 | Yes |
| 73 | ADCY7 | n/a | 12702 | -0.423 | -0.2506 | Yes |
| 74 | PRKX | n/a | 12737 | -0.427 | -0.2332 | Yes |
| 75 | PLCB4 | n/a | 12824 | -0.436 | -0.2190 | Yes |
| 76 | CACNA1S | n/a | 12856 | -0.441 | -0.2008 | Yes |
| 77 | PLCB2 | n/a | 13259 | -0.505 | -0.2055 | Yes |
| 78 | PRKCD | n/a | 13350 | -0.523 | -0.1876 | Yes |
| 79 | CACNA1C | n/a | 13457 | -0.547 | -0.1697 | Yes |
| 80 | MAPK7 | n/a | 13508 | -0.559 | -0.1473 | Yes |
| 81 | GNRH1 | n/a | 13819 | -0.659 | -0.1385 | Yes |
| 82 | MAPK12 | n/a | 14107 | -0.819 | -0.1207 | Yes |
| 83 | MAPK11 | n/a | 14177 | -0.870 | -0.0852 | Yes |
| 84 | ADCY4 | n/a | 14236 | -0.939 | -0.0457 | Yes |
| 85 | HBEGF | n/a | 14331 | -1.165 | 0.0016 | Yes |