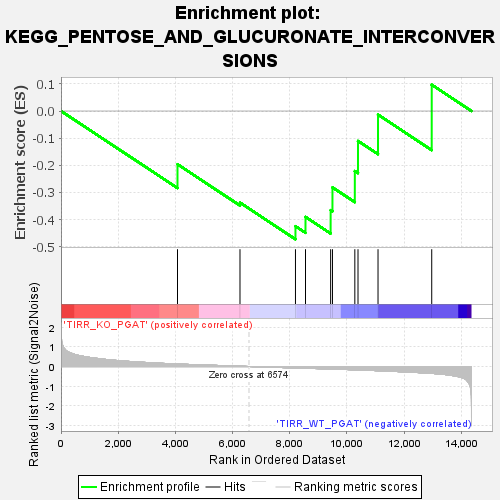
Profile of the Running ES Score & Positions of GeneSet Members on the Rank Ordered List
The same image in compressed SVG format
| Dataset | TIRRKO_WT_PGAT.TIRR_KO_PGAT_vs_TIRR_WT_PGAT.cls #TIRR_KO_PGAT_versus_TIRR_WT_PGAT.TIRR_KO_PGAT_vs_TIRR_WT_PGAT.cls #TIRR_KO_PGAT_versus_TIRR_WT_PGAT_repos |
| Phenotype | TIRR_KO_PGAT_vs_TIRR_WT_PGAT.cls#TIRR_KO_PGAT_versus_TIRR_WT_PGAT_repos |
| Upregulated in class | TIRR_WT_PGAT |
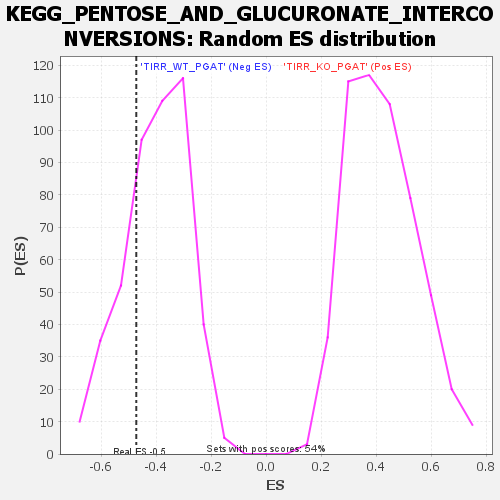
| GeneSet | KEGG_PENTOSE_AND_GLUCURONATE_INTERCONVERSIONS |
| Enrichment Score (ES) | -0.47287214 |
| Normalized Enrichment Score (NES) | -1.1747078 |
| Nominal p-value | 0.28448275 |
| FDR q-value | 0.32727158 |
| FWER p-Value | 1.0 |
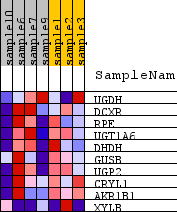
| SYMBOL | TITLE | RANK IN GENE LIST | RANK METRIC SCORE | RUNNING ES | CORE ENRICHMENT | |
|---|---|---|---|---|---|---|
| 1 | UGDH | n/a | 4074 | 0.127 | -0.1963 | No |
| 2 | DCXR | n/a | 6259 | 0.016 | -0.3377 | No |
| 3 | RPE | n/a | 8199 | -0.070 | -0.4247 | Yes |
| 4 | UGT1A6 | n/a | 8550 | -0.085 | -0.3905 | Yes |
| 5 | DHDH | n/a | 9429 | -0.125 | -0.3656 | Yes |
| 6 | GUSB | n/a | 9493 | -0.128 | -0.2815 | Yes |
| 7 | UGP2 | n/a | 10275 | -0.166 | -0.2214 | Yes |
| 8 | CRYL1 | n/a | 10386 | -0.172 | -0.1105 | Yes |
| 9 | AKR1B1 | n/a | 11086 | -0.212 | -0.0134 | Yes |
| 10 | XYLB | n/a | 12964 | -0.350 | 0.0969 | Yes |